Diet & recipe app concept · 2022
Designing a diet app that does the calorie math for people with no time
A survey of 50 dieters and 10 follow-up interviews showed calories mattered most, and that looking them up and deciding what to eat took the time people lacked. I designed Fitter to do that work: onboarding builds a personal plan, and Home is organized around the next meal. A one-month practice in the UX process, from research to hi-fi: a concept, not a product. Not launched, not tested.
- User research
- Survey
- Personas
- Information architecture
- Mobile UI
- Role
- Solo designer · practice project
- Team
- Solo · 10 interviewees as input
- Timeline
- 1 month · Nov 2022
- Platform
- iOS app concept
- Outcome
- Hi-fi concept · not built
TL;DR
Summary
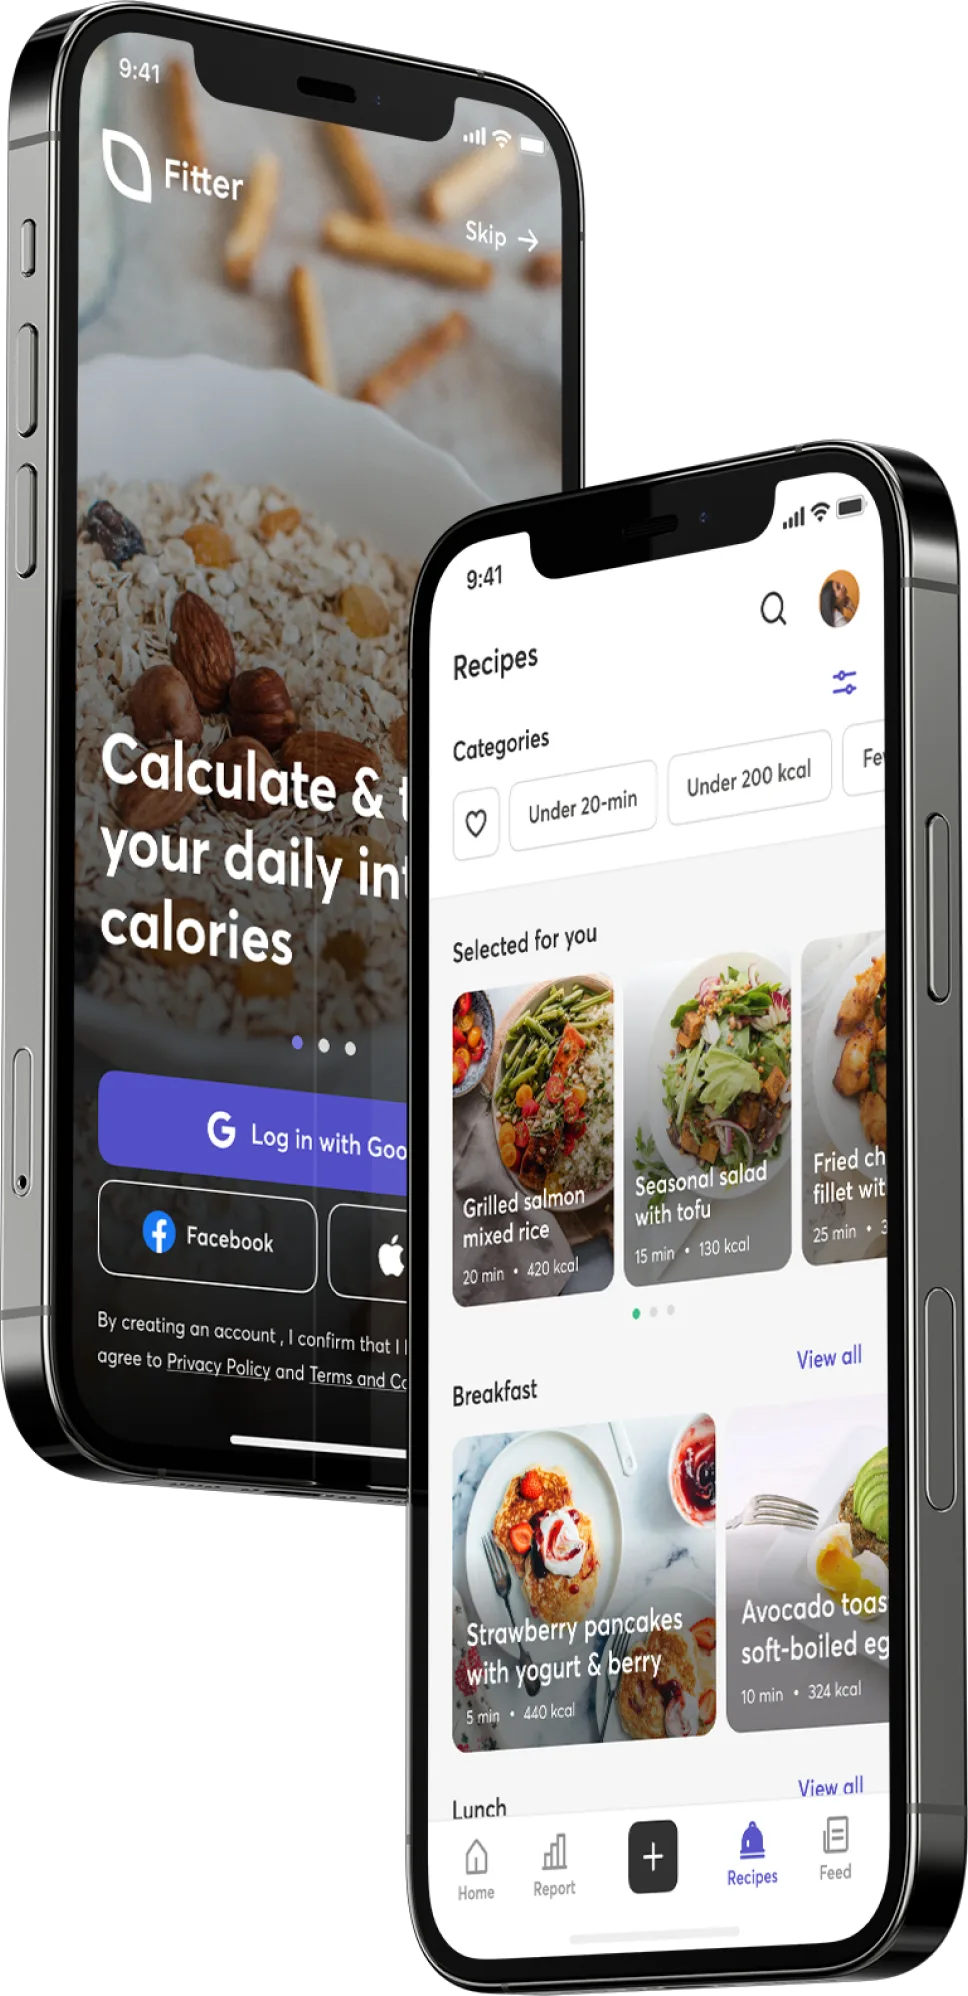
Calories were what dieters cared about most. Time was what they lacked most. So the app does the counting and plans the next meal. Onboarding explains why it asks each question. Home answers “what should I eat next?” instead of showing weight. Recipes carry finished-dish calories, so cooking competes with ordering.
- Survey responses
- 50
- Complete answers kept, from Facebook diet & gym groups
- Follow-up interviews
- 10
- Survey respondents, mostly over chat
- Weigh calories when choosing food
- 49/50
- Survey, multi-select; top answer
- Struggle with lack of time
- 40/50
- Survey, multi-select; top difficulty
Dieting ran on calorie math, and on time people didn't have
Calorie counts, recipes and meal plans were scattered across food labels, blogs and several apps. A design practice project: I wanted to run every step of the UX process on one real problem, not redesign a famous app.
Every interviewee described the same chore: looking up calories per weight for each food, a number that changes with how it's cooked. Deciding what to eat took time too, and recipes online rarely gave calories for the finished dish. How might one app take that work off their plate?
40 / 50named lack of time as a difficulty; interviews traced it to calorie lookups and meal planning
Two kinds of dieters: those who cook and those who order
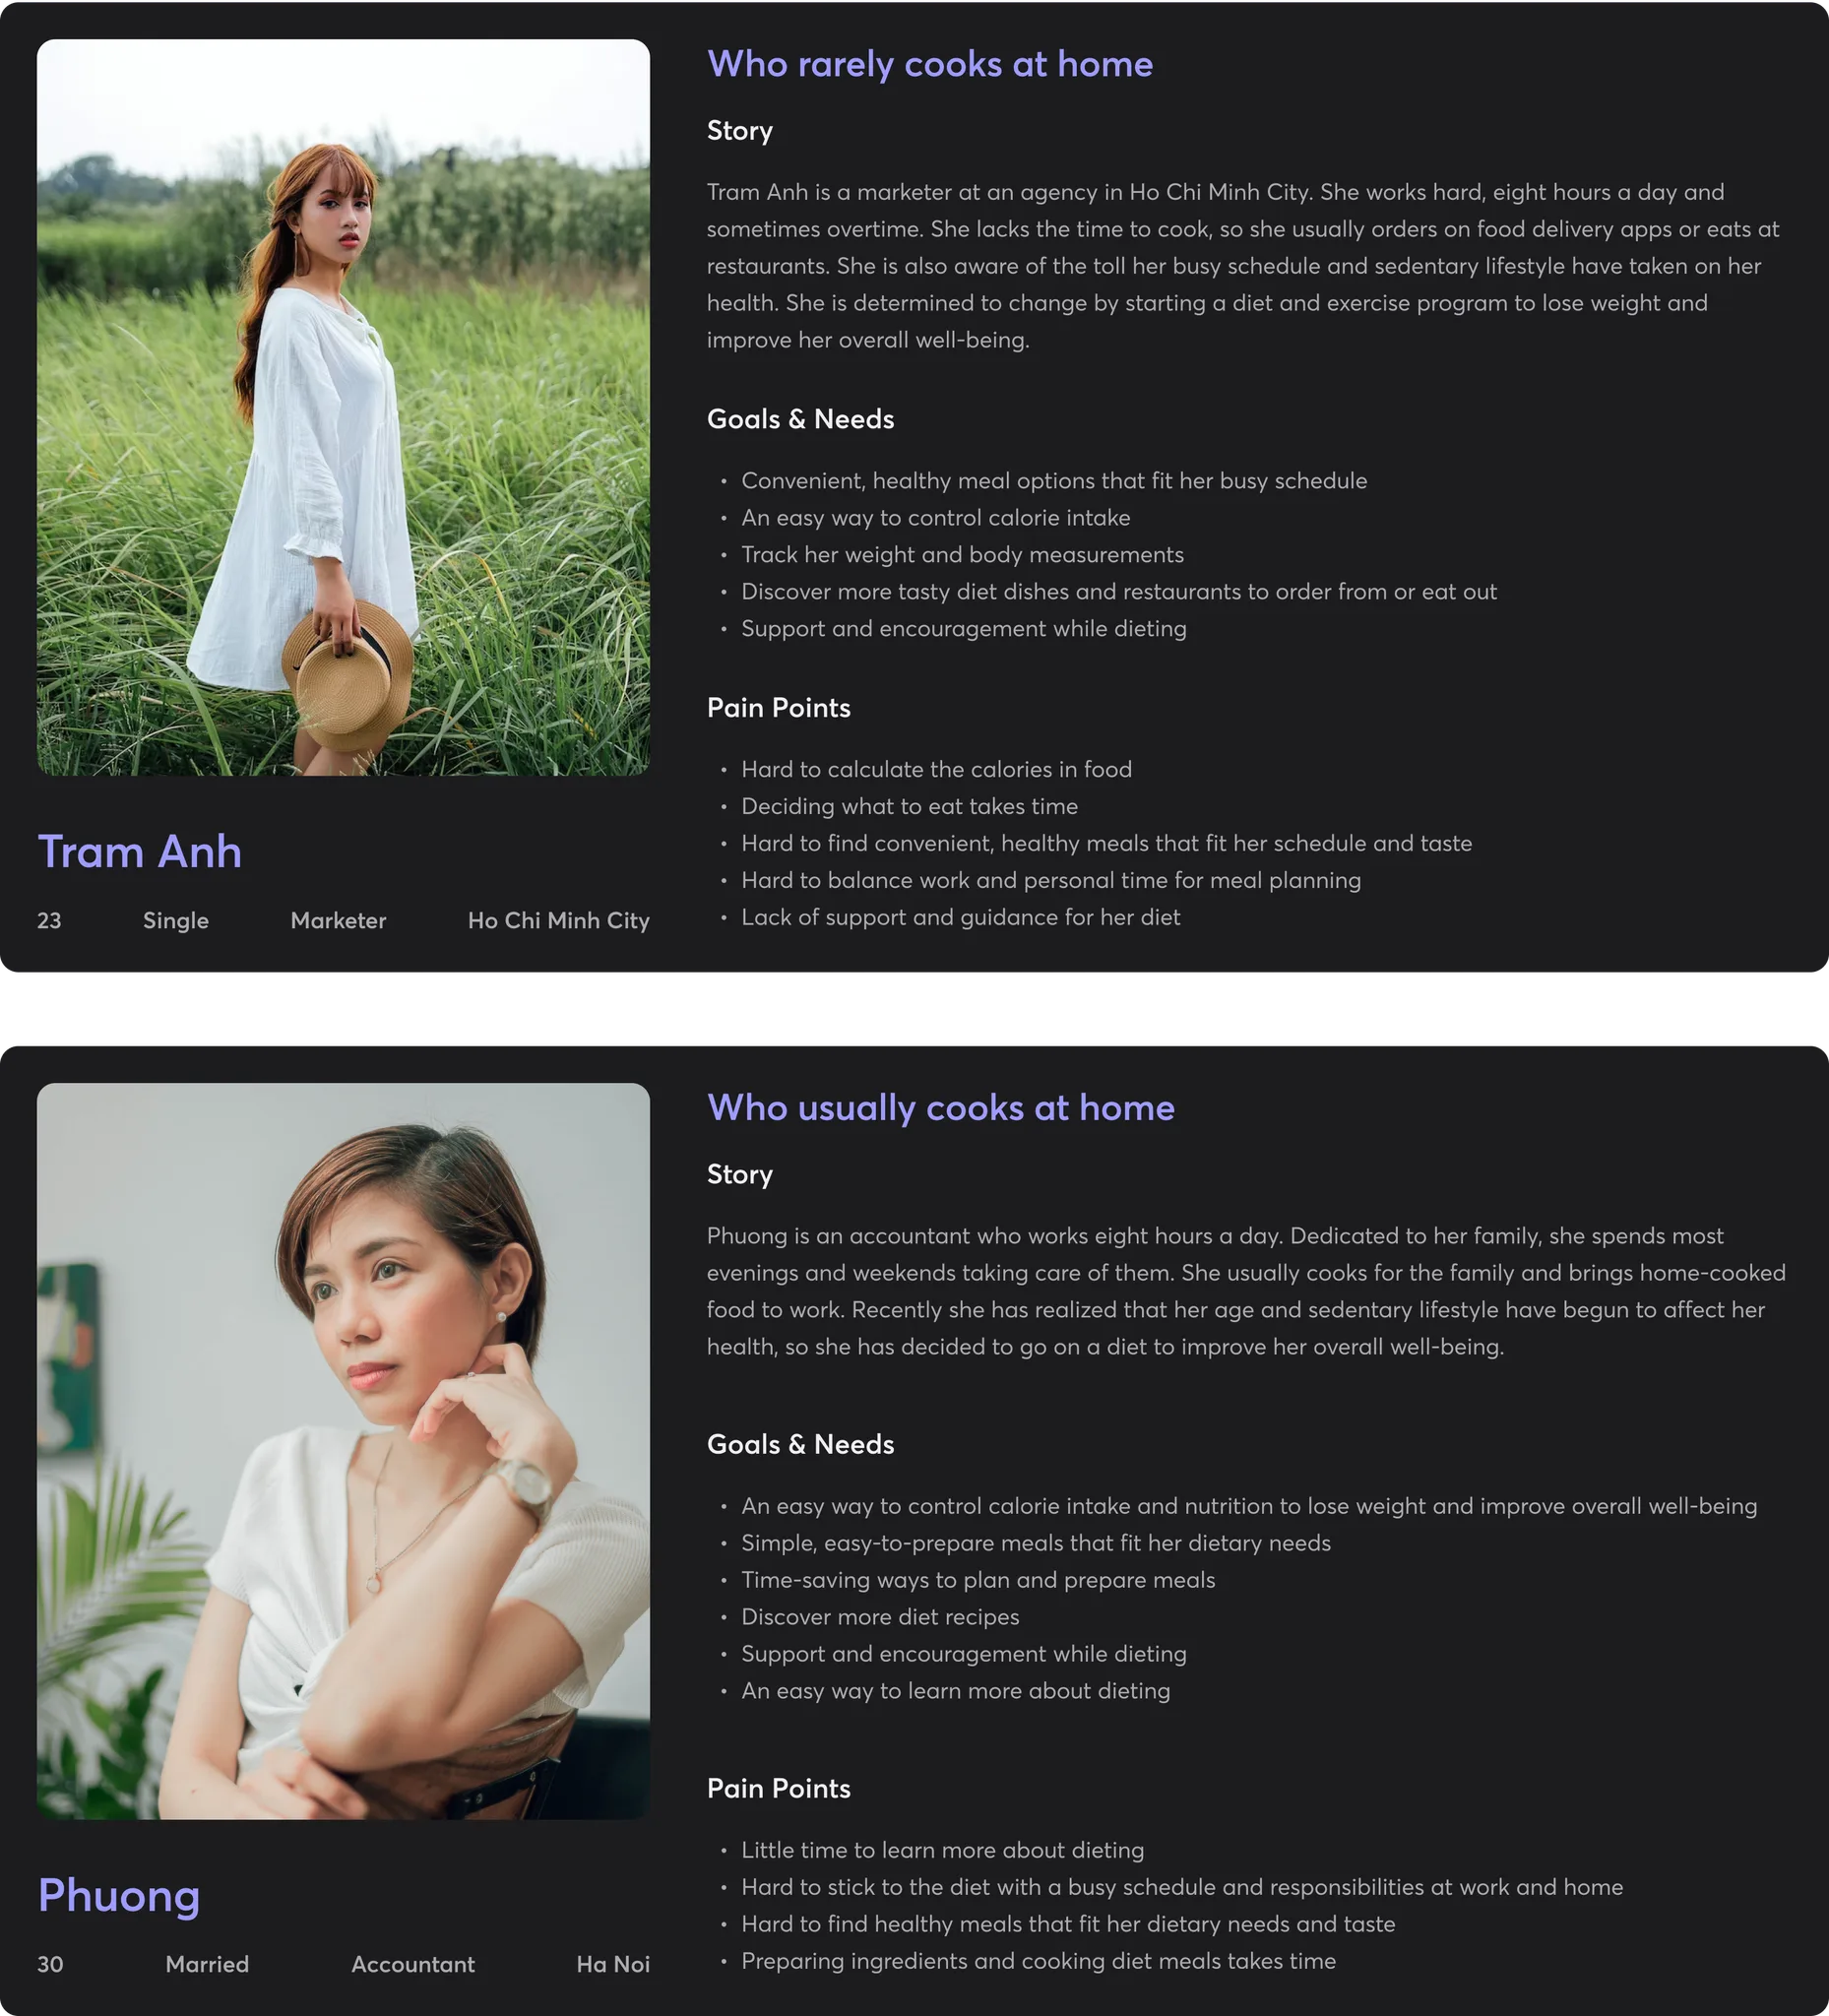
I posted a survey in Facebook groups for dieters and gym-goers and kept the 50 most complete answers. Then I followed up with 10 respondents, mostly over chat and in the post's comments, to learn why they answered the way they did.
The answers split on one behavior, cooking, so I built two personas around it: Phuong, who cooks for her family, and Tram Anh, who orders most meals. They draw on the interviews, filled in with my own assumptions where answers were thin.
01
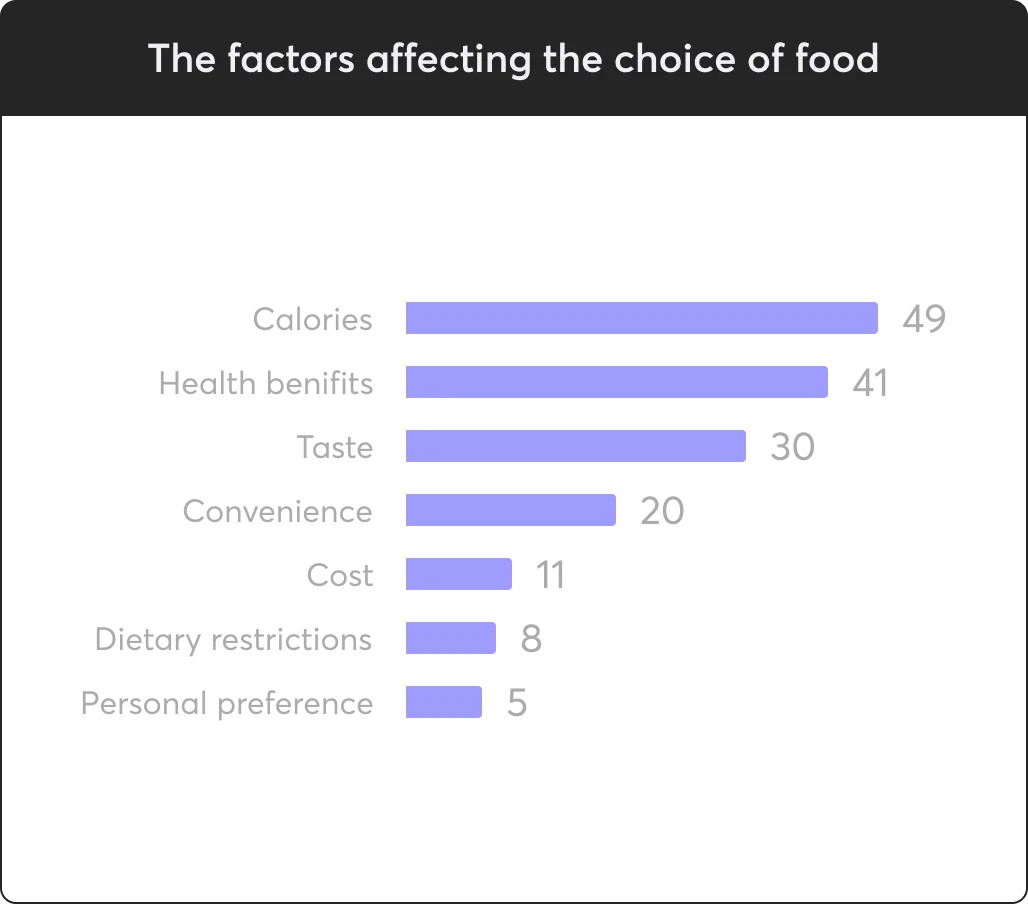
Calories decide what people eat
49 of 50 weigh calories when choosing food. Getting the number means looking up each ingredient by weight and cooking method, every meal.
02
Cooking splits the audience
32 cook at home, 18 order or eat out. Orderers weren't against cooking: finding a recipe and counting it took too long, while healthy restaurants print calories on the label.
03
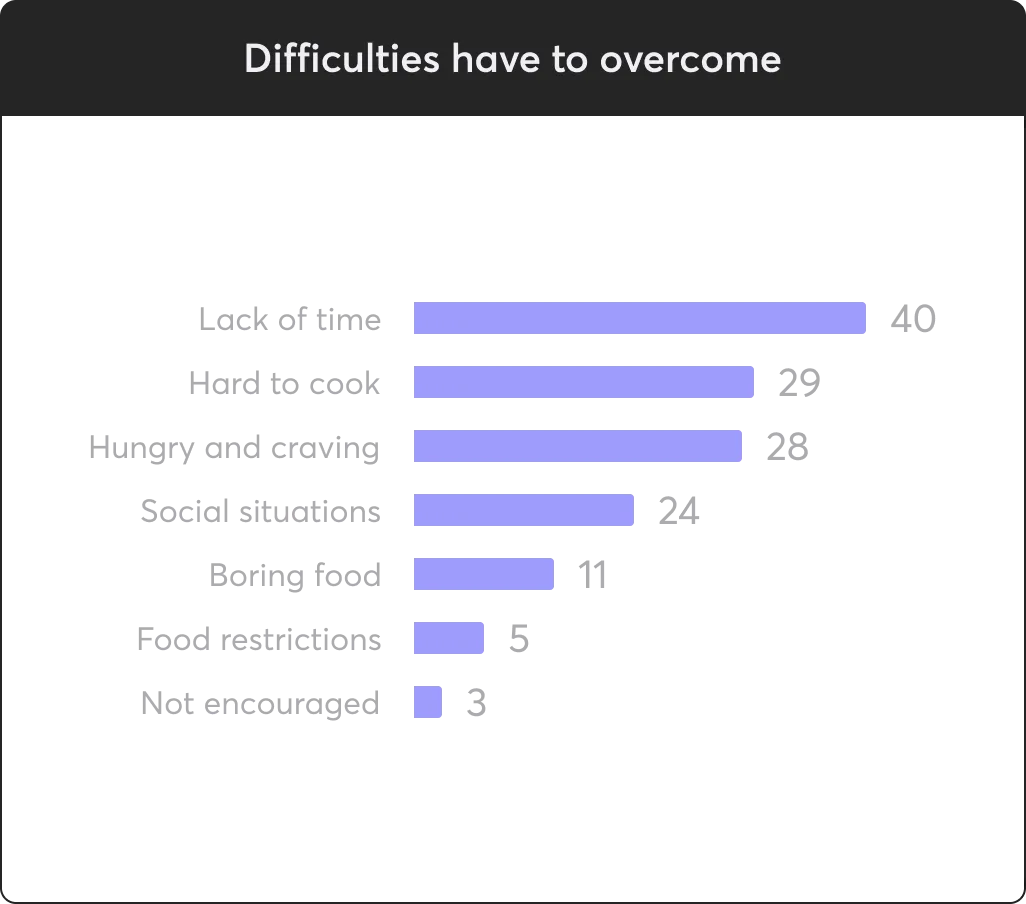
Cravings and boredom break diets
28 struggled with hunger and cravings, 11 with eating the same few dishes. Interviewees described giving up on the plan when meals got repetitive.
A dozen questions, three flows worth designing first
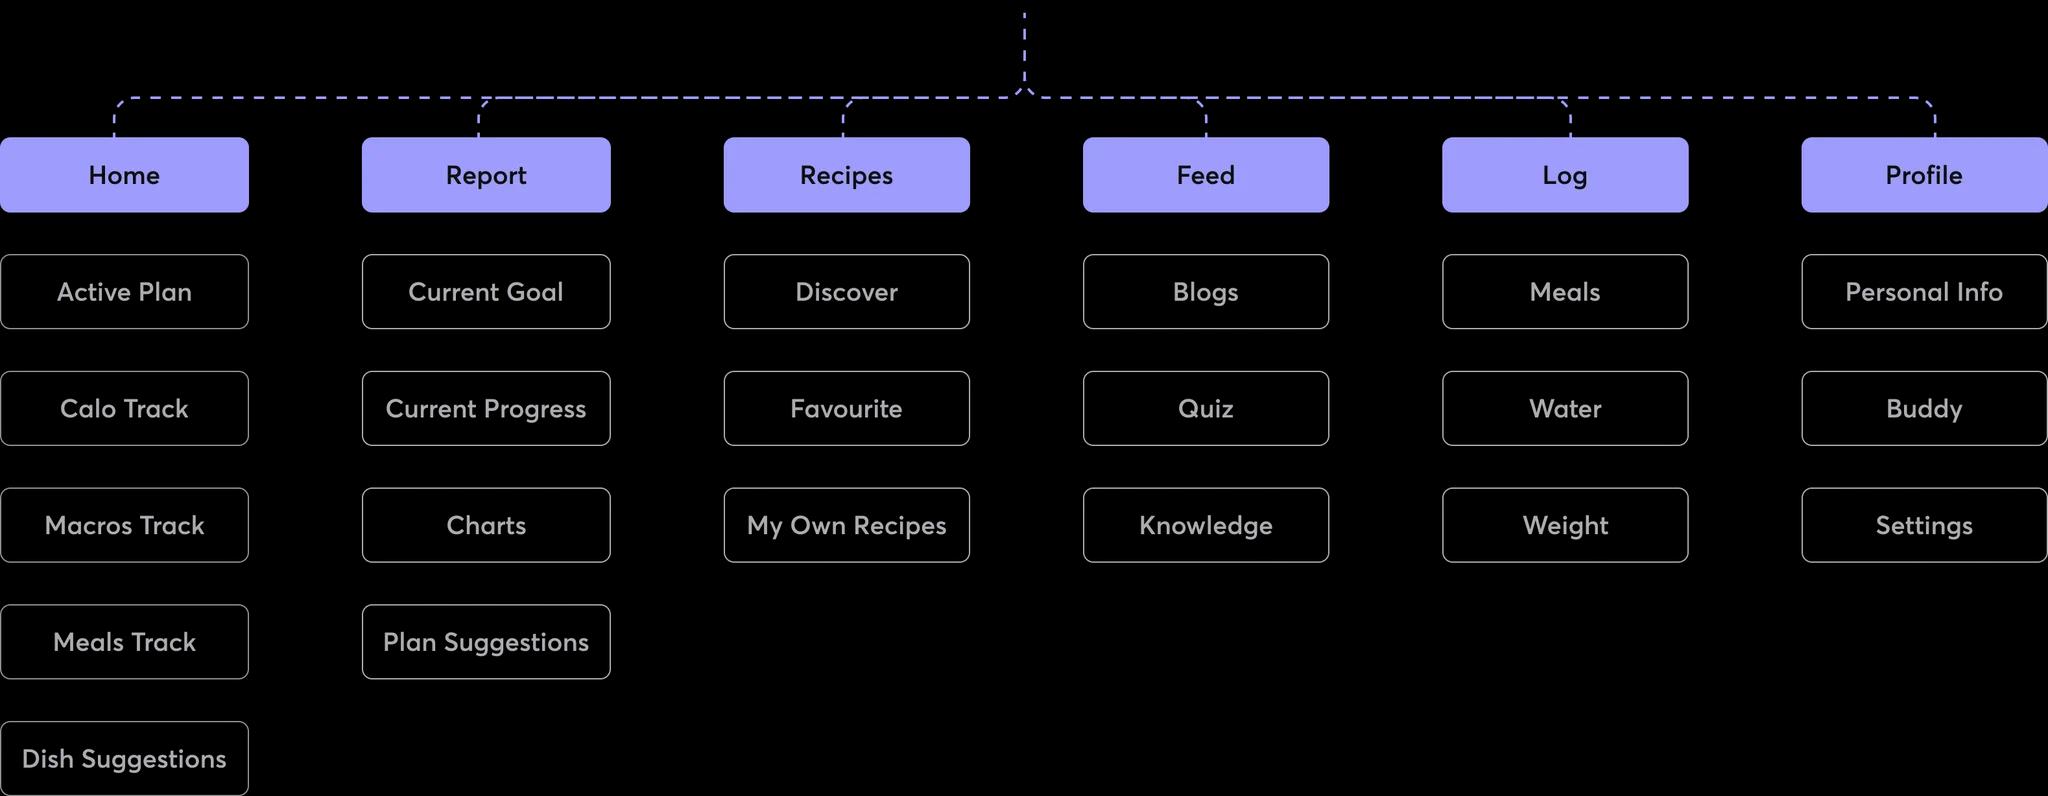
Mapping both personas' journeys gave me a dozen “How might we” questions, from choosing a diet to sharing results. I took each one back to the data and designed for the two the survey ranked highest: counting calories and deciding what to eat.
01Designed
A plan built from your body and goal
Onboarding sets calorie and macro targets.
02Designed
Home around the next meal
Calories left, today's meals, recipe suggestions.
03Designed
Logging and recipes with calories
Log from recent foods; recipes show finished-dish calories.
04Not designed
Ordering out
No restaurant or delivery flow. Recipes had to win orderers back instead.
05Idea · IA only
Feed, buddies, quizzes, blogs
Motivation and sharing. One feed screen sketched.
Let the app do the math, and plan the next meal
01
Ask more up front, and say why every time
- Insight
- A plan is only personal if calorie and macro targets come from the user's goal, weight, height, age, sex and activity level.
- Decision
- Eight short steps instead of a quick start. Each says what the answer is for (“Calorie intake and serving size are suggested based on your current weight”) and uses pickers with defaults, so most take one swipe.
- Trade-off
- Five answers are enough to calculate targets. I kept goal weight and disliked foods up front so the first plan and suggestions felt personal, at the cost of a longer flow. If testing showed drop-off, those two would move later.
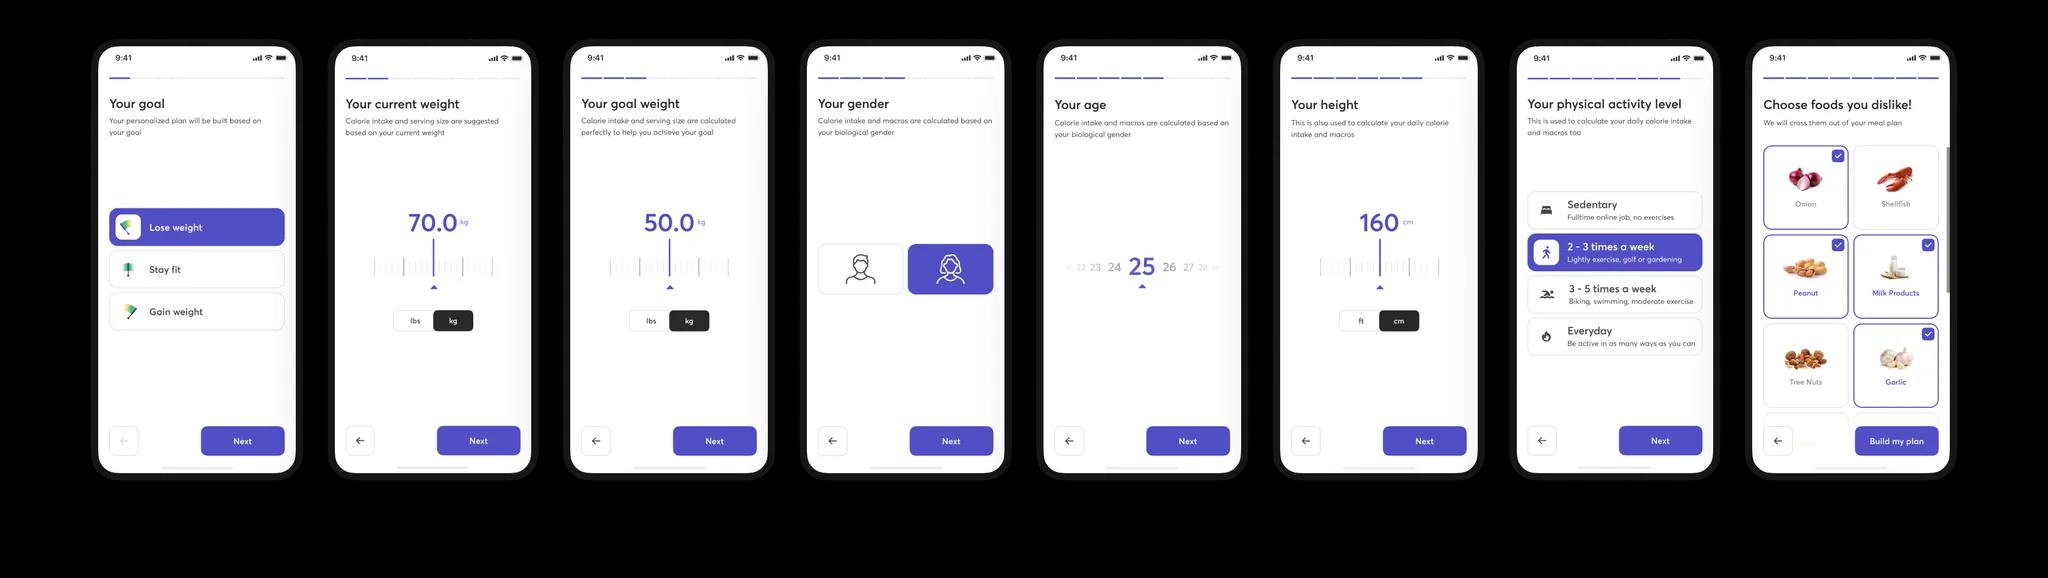
(Every step says what the answer is used for) 02
Win orderers back to the kitchen, don't build for delivery
- Insight
- Tram Anh ordered because finding a recipe and counting it took too long. Healthy restaurants print the number on the label.
- Decision
- No restaurant flow. Every recipe gives what the label gave, total calories for the finished dish, plus ingredients and steps, and the menu becomes whatever the user likes.
- Trade-off
- People who won't cook get nothing from Fitter. Whether a calorie count is enough to make someone cook instead of order is the biggest untested bet.
03
Build Home around the next meal, not the scale
- Insight
- Weight was the goal, but deciding what to eat was the daily work. And 11 of 50 struggled with eating the same few dishes.
- Decision
- Home shows calories left, macros, today's meals and suggestions for the next one. Suggestions skip foods disliked in onboarding and lean on recipes the user liked, so meals keep changing. Weight lives in Report.
- Trade-off
- Progress is one tab away. My assumption, not an interview finding: dieters, women especially, already feel pressure about the number, so it shouldn't greet them every morning.
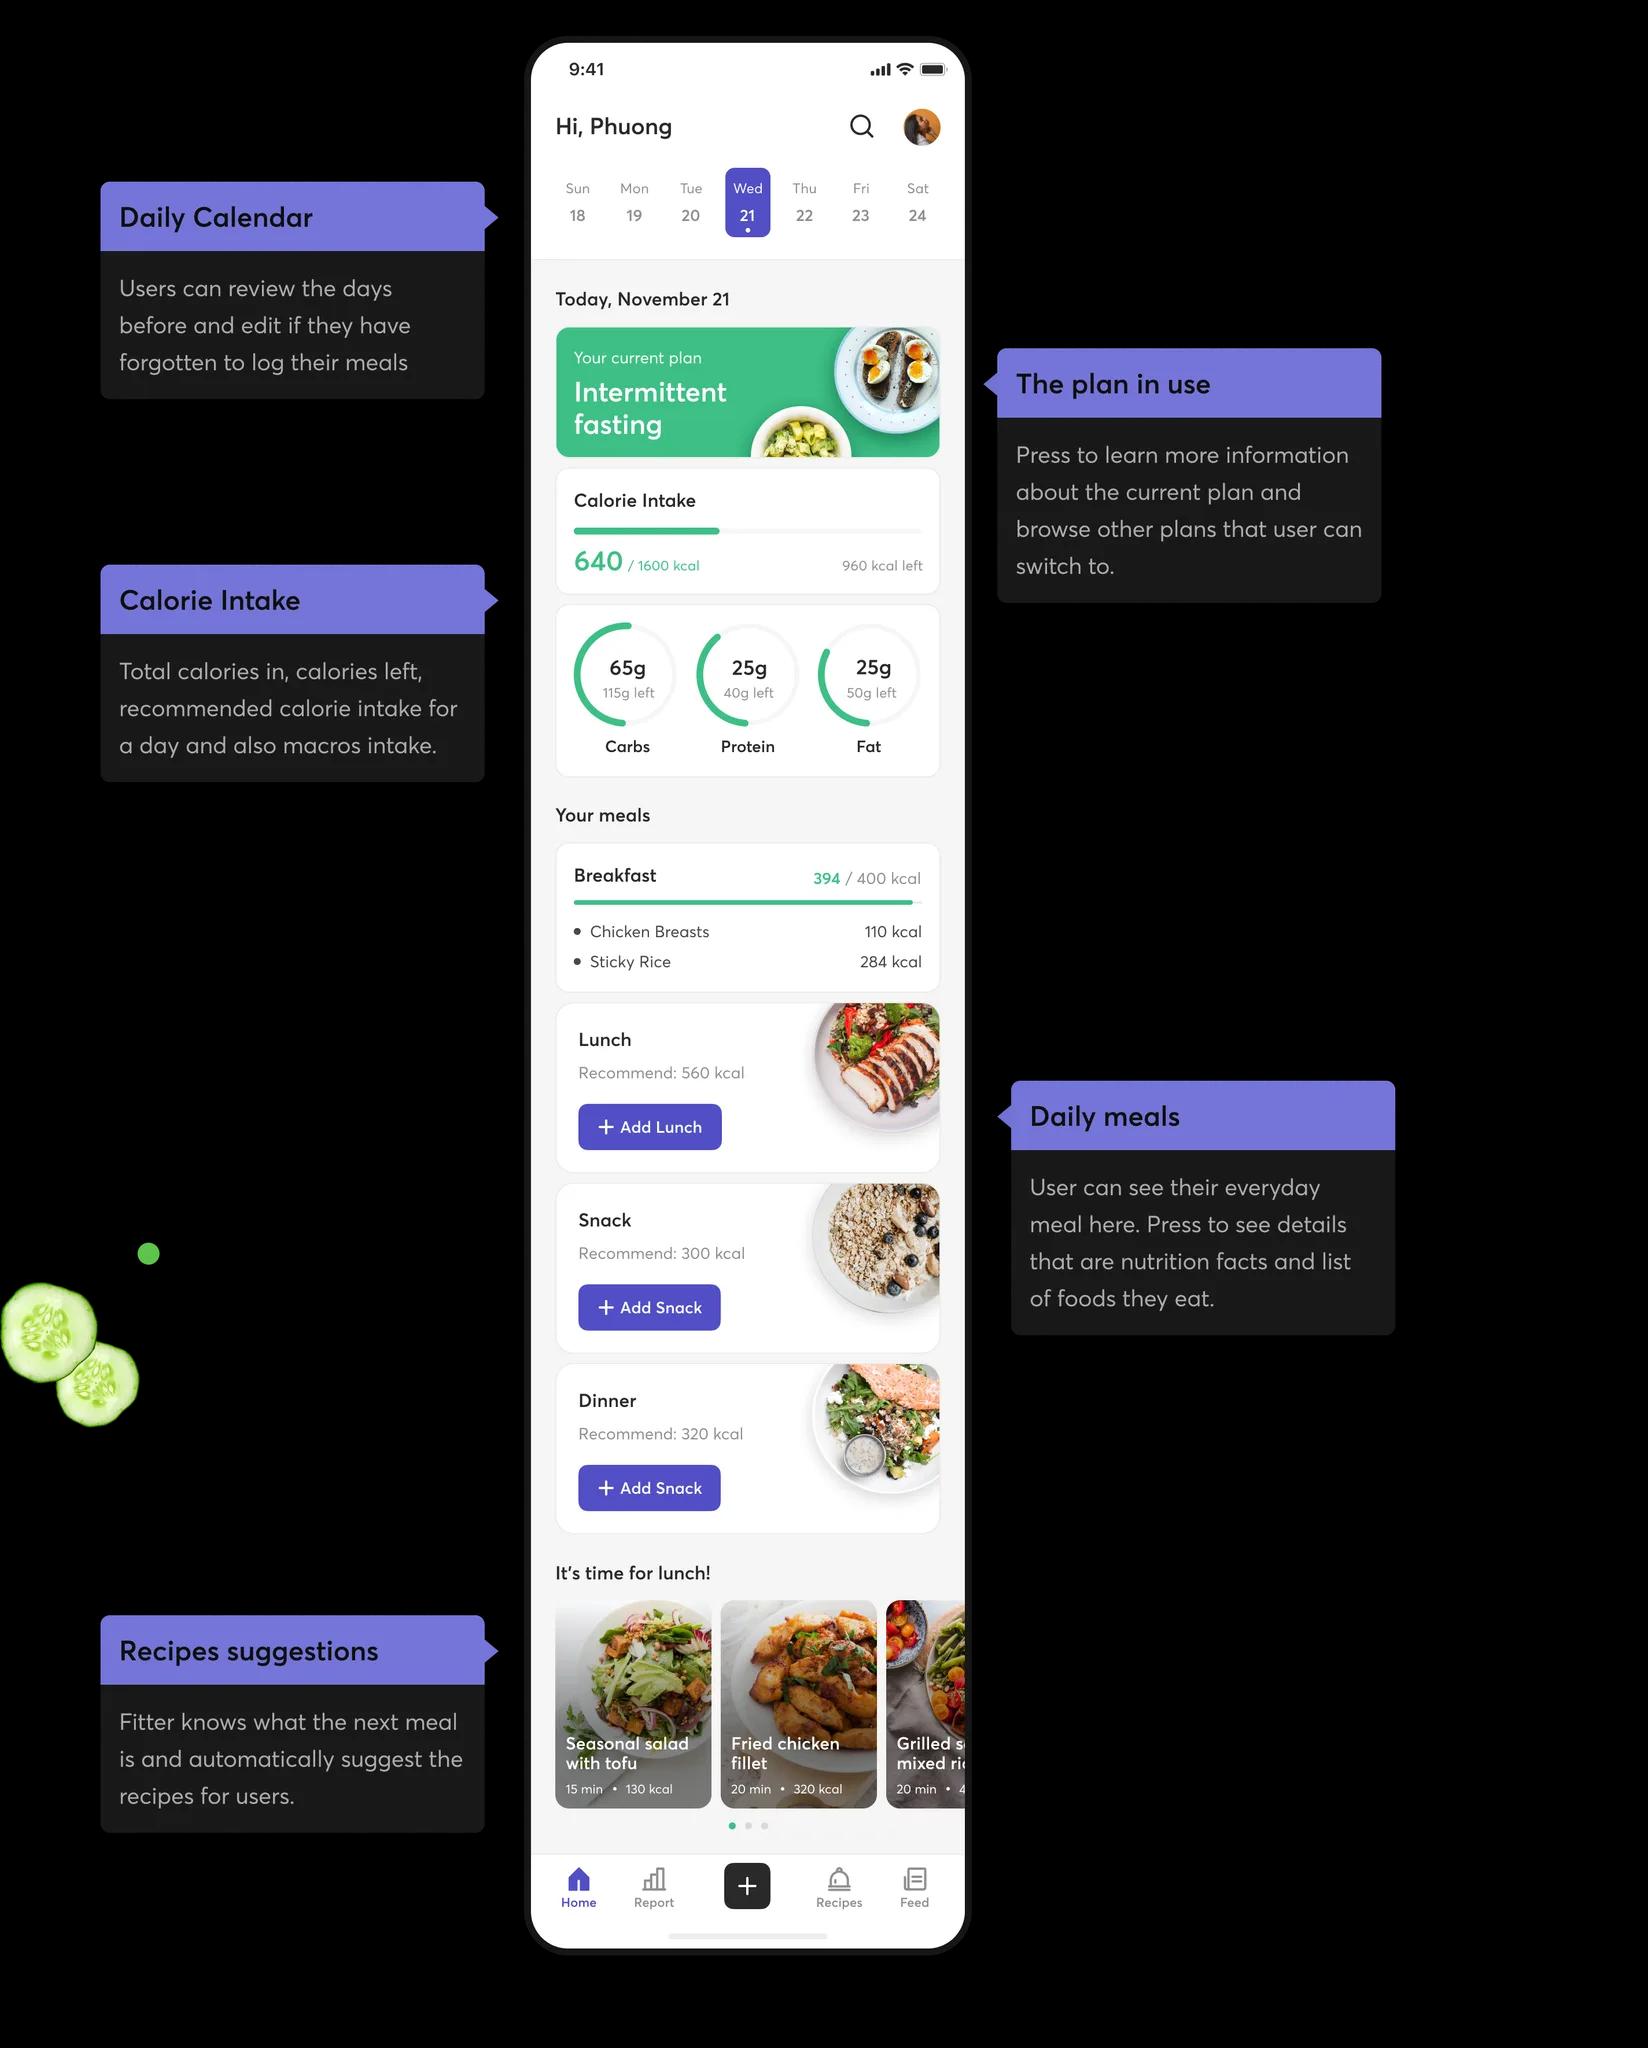
(Today's calories and the next meal, no weight in sight) 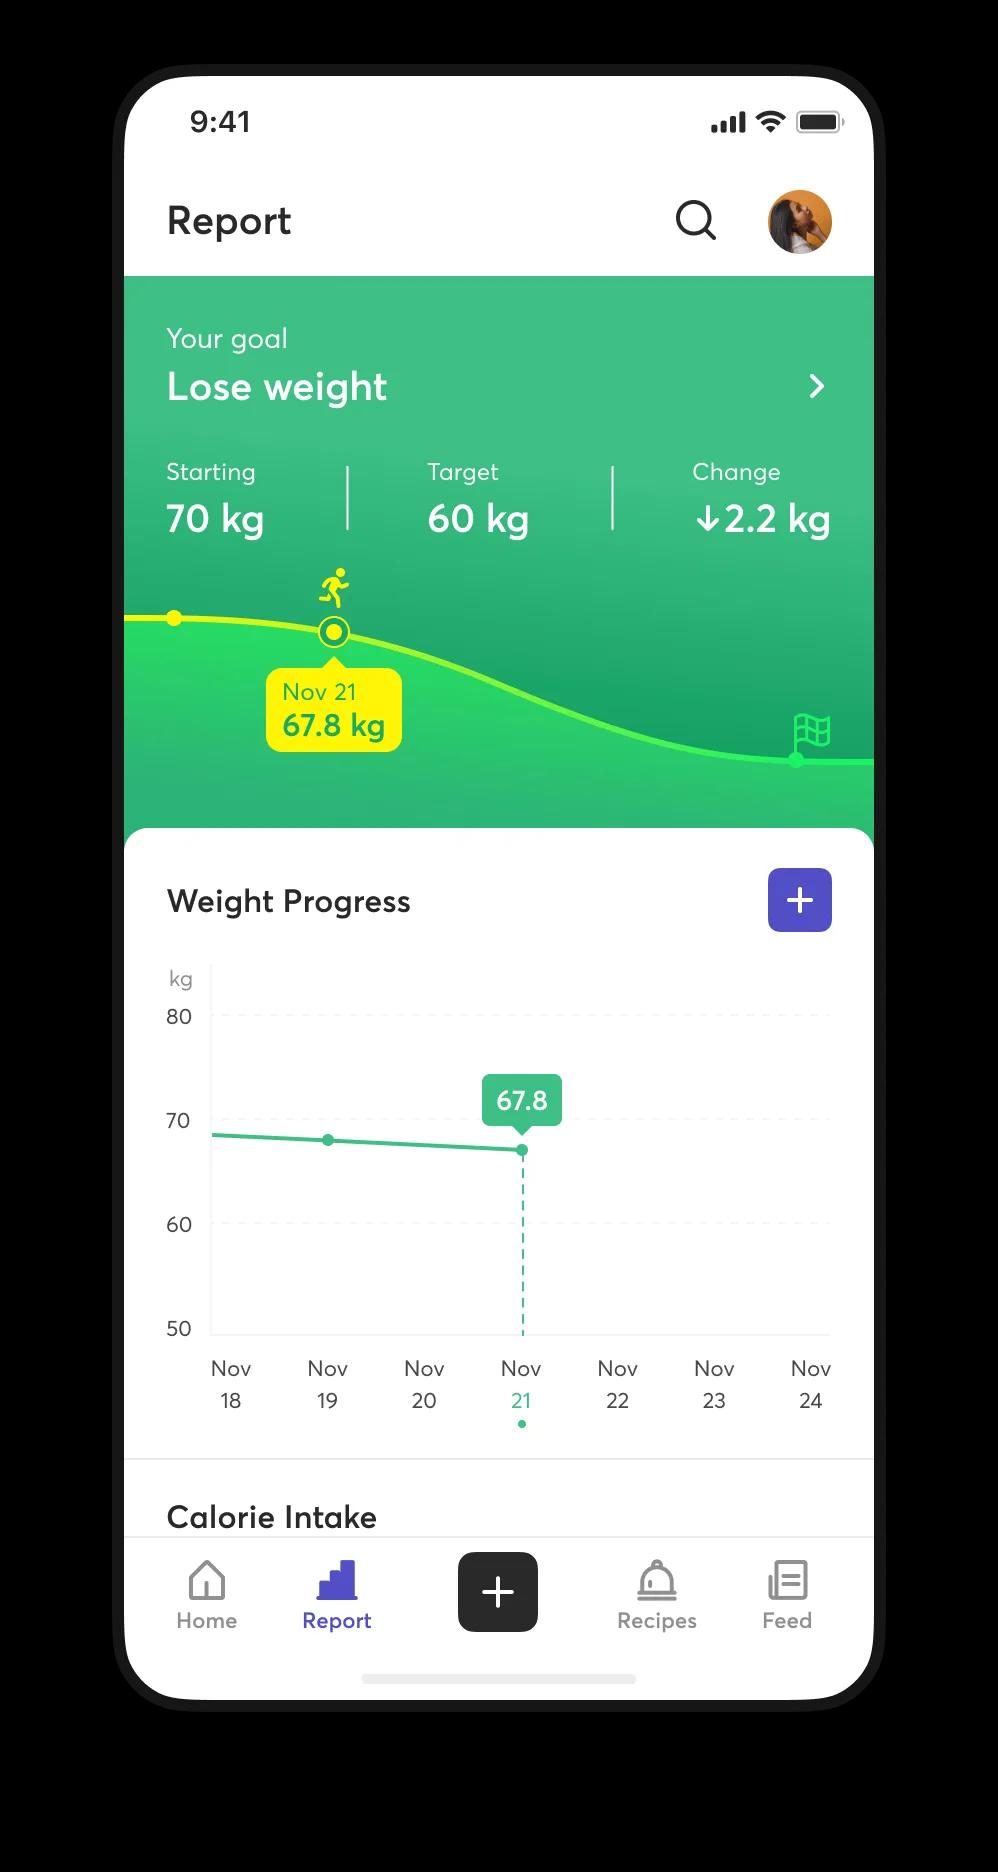
(Weight progress, one tab away in Report) 04
Log a meal from what you already eat
- Insight
- Interviewees looked up nutrition facts food by food, and the number changed with weight and cooking method.
- Decision
- Logging starts from recent foods and search; serving size and nutrition sit on one sheet, totals calculated. Manual entry stays as a fallback.
- Trade-off
- It only works with a large, accurate food database, which a real product would have to build or license.
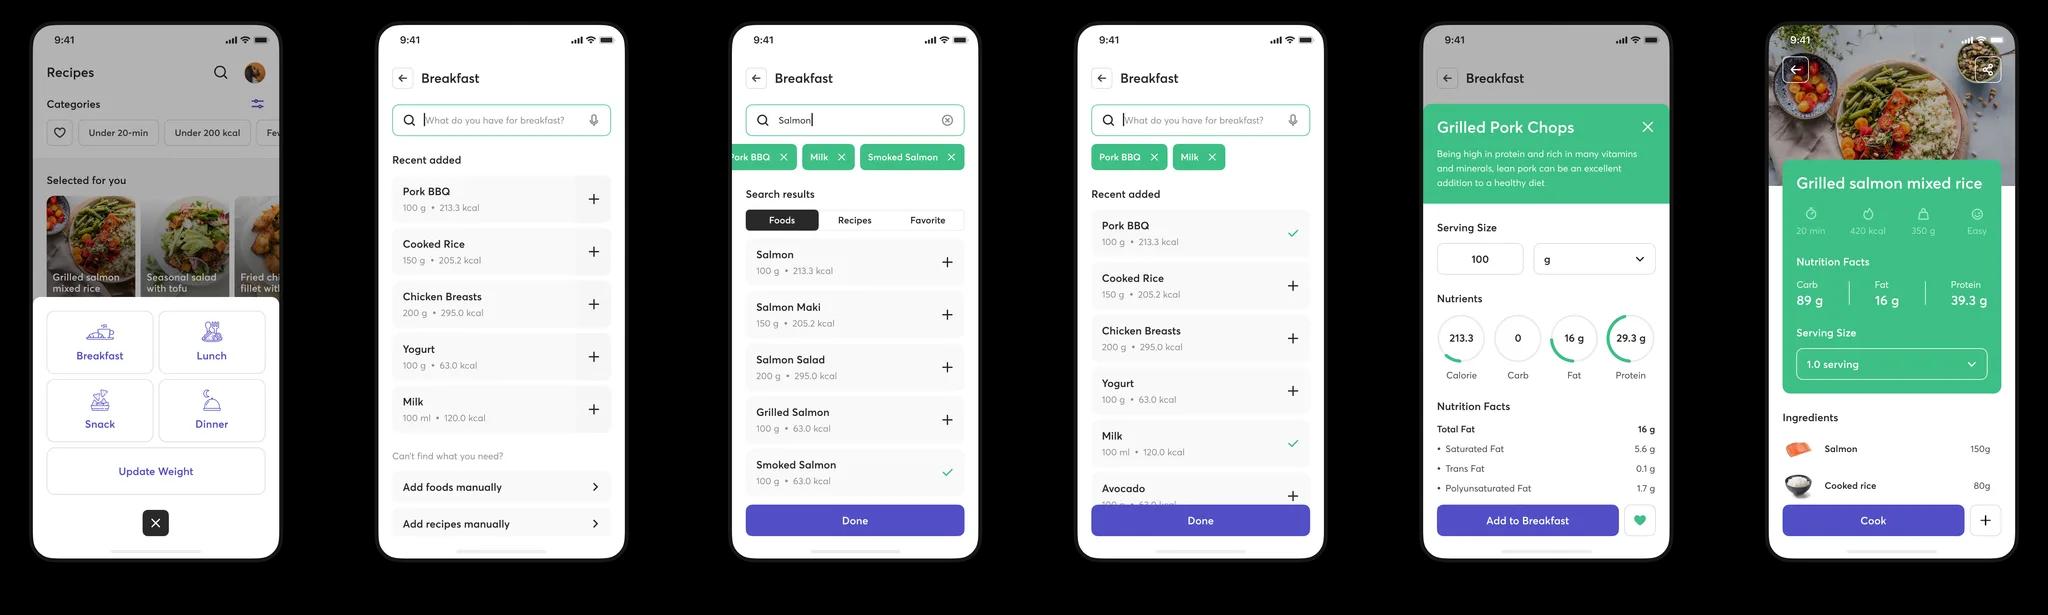
(Recent foods first, numbers calculated for you)
Designed, not yet tested
The practice stopped at hi-fi: no prototype, no usability test, no build. Every decision above is a hypothesis built on 50 survey answers and 10 interviews.
The next step would test the core promise: is it faster? Five interviewees plan and log a day's meals in a clickable prototype, timed against their current method. If it isn't faster, the rest doesn't matter.
What practicing the process taught me
01
Each step has to feed the next
On paper, the process looked like a checklist. Doing it, an artifact only mattered when it changed what came next: the survey split the personas, their journeys produced the questions I designed for.
02
Where I recruit shapes who I design for
Posting in diet and gym groups gave me 42 women out of 50, so both personas are women. Next time I'd recruit across channels, or say up front who the design is for.
03
Test before polishing
I went from research straight to hi-fi, so screens looked finished before anyone used them. Next time: a rough prototype first.
Next case
- Turning a 1,500-user beta into a daily habit
- —